Prometheus搭建部署 官网地址:https://prometheus.io/
安装准备
同步时间
timedatectl set-timezone Asia/Shanghai
我这台服务器ip是192.168.224.11登入,建立相应文件夹
1
2
3
4
5
mkdir -p promethues mkdir -p promethues/server mkdir -p promethues/client touch promethues/server/rules.yml chmod 777 promethues/server/rules.yml
一,安装Prometheus Server 通过docker方式
1
2
3
4
5
6
7
8
9
10
11
安装docker curl -fsSl https://get.docker.com | sh systemctl start docker systemctl enable docker 安装自动补全插件 yum install -y bash-completion source /usr/share/bash-completion/completions/docker source /usr/share/bash-completion/bash_completion
Docker 部署 Prometheus 说明:
监控端安装:
被监控安装:
1.安装Node Exporter
所有服务器安装
Node Exporter 收集系统信息,用于监控CPU、内存、磁盘使用率、磁盘读写等系统信息
–net=host,这样 Prometheus Server 可以直接与 Node Exporter 通信
1
2
3
4
5
6
7
8
9
10
docker run -d -p 9100:9100 \ -v "/proc:/host/proc" \ -v "/sys:/host/sys" \ -v "/:/rootfs" \ -v "/etc/localtime:/etc/localtime" \ --net=host \ prom/node-exporter \ --path.procfs /host/proc \ --path.sysfs /host/sys \ --collector.filesystem.ignored-mount-points "^/(sys|proc|dev|host|etc)($|/)"
2.安装cAdvisor
所有服务器安装
cAdvisor 收集docker信息,用于展示docker的cpu、内存、上传下载等信息
–net=host,这样 Prometheus Server 可以直接与 cAdvisor 通信
1
2
3
4
5
6
7
8
9
10
11
12
docker run -d \ -v "/etc/localtime:/etc/localtime" \ --volume=/:/rootfs:ro \ --volume=/var/run:/var/run:rw \ --volume=/sys:/sys:ro \ --volume=/var/lib/docker/:/var/lib/docker:ro \ --volume=/dev/disk/:/dev/disk:ro \ --publish=18104:8080 \ --detach=true \ --name=cadvisor \ --privileged=true \ google/cadvisor:latest
1
2
可以进入容器查看: sudo docker exec -it 容器id /bin/sh
3.安装Prometheus Server 监控端安装
1)编辑配置文件
首先在本地创建 prometheus.yml 这是普罗米修斯的配置文件
将下方内容写入到文件中
将监听的地址改为自己本机地址
1
2
3
4
5
6
7
8
9
10
11
12
13
14
15
16
17
18
19
20
21
22
23
24
25
26
27
28
29
30
# my global config global: scrape_interval: 15s # Set the scrape interval to every 15 seconds. Default is every 1 minute. evaluation_interval: 15s # Evaluate rules every 15 seconds. The default is every 1 minute. # scrape_timeout is set to the global default (10s). # Alertmanager configuration alerting: alertmanagers: - static_configs: - targets: # - alertmanager:9093 # Load rules once and periodically evaluate them according to the global 'evaluation_interval'. rule_files: # - "first_rules.yml" # - "second_rules.yml" # A scrape configuration containing exactly one endpoint to scrape: # Here it's Prometheus itself. scrape_configs: # The job name is added as a label `job=<job_name>` to any timeseries scraped from this config. - job_name: 'prometheus' # metrics_path defaults to '/metrics' # scheme defaults to 'http'. static_configs: #监听的地址s - targets: ['localhost:9090','192.168.224.11:8088','192.168.224.11:9090']
2)启动容器
1> prometheus.yml配置文件
prometheus.yml内需配置外网ip,内网ip除了本机,在grafana识别不到!
1
2
3
4
5
6
7
8
9
10
11
12
13
14
15
16
17
18
19
20
21
22
23
24
25
26
27
28
29
30
31
32
33
34
35
36
37
38
39
40
41
42
43
44
45
46
47
48
49
# my global confi global: scrape_interval: 15s # Set the scrape interval to every 15 seconds. Default is every 1 minute. evaluation_interval: 15s # Evaluate rules every 15 seconds. The default is every 1 minute. # scrape_timeout is set to the global default (10s). # Alertmanager configuration alerting: alertmanagers: - static_configs: - targets: # - alertmanager:9093 # Load rules once and periodically evaluate them according to the global 'evaluation_interval'. rule_files: # - "first_rules.yml" # - "second_rules.yml" # A scrape configuration containing exactly one endpoint to scrape: # Here it's Prometheus itself. scrape_configs: # The job name is added as a label `job=<job_name>` to any timeseries scraped from this config. - job_name: 'prometheus' # metrics_path defaults to '/metrics' # scheme defaults to 'http'. static_configs: #监听的地址(此处为服务器内网ip) - targets: ['10.27.158.33:9090','10.27.158.33:9100','10.27.158.33:18104'] - targets: ['10.29.46.54:9100','10.29.46.54:18104'] - targets: ['10.27.163.172:9100','10.27.163.172:18104'] # - job_name: 'GitLab' # metrics_path: '/-/metrics' # static_configs: # - targets: ['172.23.0.241:10101'] - job_name: 'jenkins' metrics_path: '/prometheus/' scheme: http bearer_token: bearer_token static_configs: - targets: ['172.23.0.242:8080'] - job_name: "Nginx" metrics_path: '/status/format/prometheus' static_configs: - targets: ['172.23.0.242:8088']
2>启动命令
–net=host,这样 Prometheus Server 可以直接与 Exporter 和 Grafana 通
1
2
3
4
5
6
7
8
9
10
docker run -d -p 9090:9090 \ -v /root/Prometheus/prometheus.yml:/etc/prometheus/prometheus.yml \ -v "/etc/localtime:/etc/localtime" \ --name prometheus \ --net=host \ prom/prometheus:latest # 当Prometheus容器启动成功后访问 # PS:服务器需开启eth0的外网端口,才可用浏览器访问 9090 0.0.0.0 192.168.224.11:9090
访问http://192.168.224.11:9090
访问http://192.168.224.11:9090/metrics
我们配置了9090端口,默认prometheus会抓取自己的/metrics接口
4.创建运行Grafana
1
2
3
4
5
6
7
8
9
10
11
docker run -d -i -p 3000:3000 \ -v "/etc/localtime:/etc/localtime" \ -e "GF_SERVER_ROOT_URL=http://grafana.server.name" \ -e "GF_SECURITY_ADMIN_PASSWORD=admin8888" \ --net=host \ grafana/grafana # PS:服务器需开启eth0的外网端口,才可用浏览器访问:3000 0.0.0.0 Grafana启动后,在浏览器中打开 192.168.224.11:3000 登录界面,登录: 用户名:admin 密码:admin8888
1)添加普罗米修斯服务器
填写相关数据源信息
为添加好的数据源做图形显示
5.添加监控模板
6.键值查询 通过指标 io_namespace_http_requests_total 我们可以:
1
2
3
4
查询应用的请求总量 sum(io_namespace_http_requests_total) 查询每秒Http请求量 sum(rate(io_wise2c_gateway_requests_total[5m])) 查询当前应用请求量Top N的URI topk(10, sum(io_namespace_http_requests_total) by (path))
配置Prometheus监控Nginx
1、需给Nginx安装两个模块,才可用Prometheus来监控:nginx-module-vts、geoip
2、思路:原来无论是编译、还是yum装的nginx,都需要下载同版本的tar包,基于原来安装选项的基础上,增加以上两个模块选项,进行编译安装,来替换原来的nginx,最终将原nginx目录的配置文件如nginx.conf文件、conf.d目录再移动到编译安装后的nignx目录内,最后启动nginx即可
这里官方源安装:
1
2
3
4
5
6
7
8
vim /etc/yum.repos.d/nginx.repo [nginx-stable] name=nginx stable repo baseurl=http://nginx.org/packages/centos/7/$basearch/ gpgcheck=1 enabled=1 gpgkey=https://nginx.org/keys/nginx_signing.key module_hotfixes=true
2)安装依赖
1 yum install -y gcc gcc-c++ autoconf pcre pcre-devel make automake wget httpd-tools vim tree
3)安装nginx
4)配置nginx
1 vim /etc/nginx/nginx.conf
5)启动服务
1
2
直接启动如果有报错==》重大错误,80端口有占用==》查看占用端口的服务HTTPD,停掉,在重启nginx systemctl start nginx
1.查看当前Nginx安装选项
1
2
3
4
5
6
nginx -V nginx version: nginx/1.24.0 built by gcc 4.8.5 20150623 (Red Hat 4.8.5-44) (GCC) built with OpenSSL 1.0.2k-fips 26 Jan 2017 TLS SNI support enabled configure arguments: --prefix=/etc/nginx --sbin-path=/usr/sbin/nginx --modules-path=/usr/lib64/nginx/modules --conf-path=/etc/nginx/nginx.conf --error-log-path=/var/log/nginx/error.log --http-log-path=/var/log/nginx/access.log --pid-path=/var/run/nginx.pid --lock-path=/var/run/nginx.lock --http-client-body-temp-path=/var/cache/nginx/client_temp --http-proxy-temp-path=/var/cache/nginx/proxy_temp --http-fastcgi-temp-path=/var/cache/nginx/fastcgi_temp --http-uwsgi-temp-path=/var/cache/nginx/uwsgi_temp --http-scgi-temp-path=/var/cache/nginx/scgi_temp --user=nginx --group=nginx --with-compat --with-file-aio --with-threads --with-http_addition_module --with-http_auth_request_module --with-http_dav_module --with-http_flv_module --with-http_gunzip_module --with-http_gzip_static_module --with-http_mp4_module --with-http_random_index_module --with-http_realip_module --with-http_secure_link_module --with-http_slice_module --with-http_ssl_module --with-http_stub_status_module --with-http_sub_module --with-http_v2_module --with-mail --with-mail_ssl_module --with-stream --with-stream_realip_module --with-stream_ssl_module --with-stream_ssl_preread_module --with-cc-opt='-O2 -g -pipe -Wall -Wp,-D_FORTIFY_SOURCE=2 -fexceptions -fstack-protector-strong --param=ssp-buffer-size=4 -grecord-gcc-switches -m64 -mtune=generic -fPIC' --with-ld-opt='-Wl,-z,relro -Wl,-z,now -pie'
2.准备模块
1
2
3
4
5
6
7
8
9
下载、解压新包 wget http://nginx.org/download/nginx-1.16.1.tar.gz tar xf nginx-1.16.1.tar.gz 克隆下载 nginx-module-vts 模块 git clone https://github.com/vozlt/nginx-module-vts 安装GeoIP模块 yum -y install epel-release geoip-devel
3.停止Nginx服务
1
2
3
4
5
6
7
8
9
10
停止nginx服务 nginx -s stop # 备份原nginx启动文件 which nginx /usr/sbin/nginx mv /usr/sbin/nginx /usr/sbin/nginx.bak # 备份原nignx目录 mv /etc/nginx nginx-1.12.2.bak
4.编译安装
1> 安装所需依赖
1
2
3
4
编译安装时可能会出现 `make: *** 没有规则可以创建“default”需要的目标“build”。 停止`的报错,是因为缺少依赖导致 安装依赖后在进行编译,否则装完依赖还得重新./configure ~ yum install -y gcc gcc++ bash-completion vim lrzsz wget expect net-tools nc nmap tree dos2unix htop iftop iotop unzip telnet sl psmisc nethogs glances bc pcre-devel zlib zlib-devel openssl openssl-devel libxml2 libxml2-dev libxslt-devel gd gd-devel perl-devel perl-ExtUtils-Embed GeoIP GeoIP-devel GeoIP-data pcre-devel
2> 编译安装
进入刚刚解压的nginx目录,编译安装
基于原来安装参数,尾部追加连个参数
–add-module=/root/packages/nginx-module-vts
1 ./configure --prefix=/etc/nginx --sbin-path=/usr/sbin/nginx --modules-path=/usr/lib64/nginx/modules --conf-path=/etc/nginx/nginx.conf --error-log-path=/var/log/nginx/error.log --http-log-path=/var/log/nginx/access.log --pid-path=/var/run/nginx.pid --lock-path=/var/run/nginx.lock --http-client-body-temp-path=/var/cache/nginx/client_temp --http-proxy-temp-path=/var/cache/nginx/proxy_temp --http-fastcgi-temp-path=/var/cache/nginx/fastcgi_temp --http-uwsgi-temp-path=/var/cache/nginx/uwsgi_temp --http-scgi-temp-path=/var/cache/nginx/scgi_temp --user=nginx --group=nginx --with-compat --with-file-aio --with-threads --with-http_addition_module --with-http_auth_request_module --with-http_dav_module --with-http_flv_module --with-http_gunzip_module --with-http_gzip_static_module --with-http_mp4_module --with-http_random_index_module --with-http_realip_module --with-http_secure_link_module --with-http_slice_module --with-http_ssl_module --with-http_stub_status_module --with-http_sub_module --with-http_v2_module --with-mail --with-mail_ssl_module --with-stream --with-stream_realip_module --with-stream_ssl_module --with-stream_ssl_preread_module --with-cc-opt='-O2 -g -pipe -Wall -Wp,-D_FORTIFY_SOURCE=2 -fexceptions -fstack-protector-strong --param=ssp-buffer-size=4 -grecord-gcc-switches -m64 -mtune=generic -fPIC' --with-ld-opt='-Wl,-z,relro -Wl,-z,now -pie' --add-module=/root/nginx-module-vts --with-http_geoip_module
1
2
3
编译安装 # -j 多核编译(配置低的不建议使用此参数,会卡住~) make -j && make install
5.配置Nginx
1
2
3
cp -r nginx-1.12.2.bak/conf.d/ /etc/nginx/ cp -r nginx-1.12.2.bak/nginx.conf /etc/nginx/ rm -f /etc/nginx/conf.d/default.conf
配置Nginx配置文件
http层
server层
1
2
3
4
5
6
7
8
9
10
11
12
13
14
15
16
17
18
19
20
21
22
23
24
25
26
27
28
29
30
31
32
33
34
··· http { ··· include /etc/nginx/conf.d/*.conf; ##################### 1.http层:添加三行配置 ##################### vhost_traffic_status_zone; vhost_traffic_status_filter_by_host on; geoip_country /usr/share/GeoIP/GeoIP.dat; ##################### 2.server层:指定server层端口号,建议8088端口,不冲突直接复制粘贴即可##################### server { listen 8088; server_name localhost; # 以下vhost配置写在此location内 location /status { vhost_traffic_status on; # 流量状态,默认即为on,可不写此行 vhost_traffic_status_display; vhost_traffic_status_display_format html; vhost_traffic_status_filter_by_set_key $uri uri::$server_name; #每个uri访问量 vhost_traffic_status_filter_by_set_key $geoip_country_code country::$server_name; #不同国家/区域请求量 vhost_traffic_status_filter_by_set_key $status $server_name; #http code统计 vhost_traffic_status_filter_by_set_key $upstream_addr upstream::backend; #后端>转发统计 vhost_traffic_status_filter_by_set_key $remote_port client::ports::$server_name; #请求端口统计 vhost_traffic_status_filter_by_set_key $remote_addr client::addr::$server_name; #请求IP统计 location ~ ^/storage/(.+)/.*$ { set $volume $1; vhost_traffic_status_filter_by_set_key $volume storage::$server_name; #请求路径统计 } } } ##################### server层:可新建一个server,或在原有的不打紧的配置上修改也可以##################### }
6.启动Nginx
1
2
nginx netstat -putnal |grep nginx
1
2
3
浏览器访问: 192.168.224.11:80 # nginx 默认官方页面 192.168.224.11:8088/status #nignx 监控项页面
7.使用Prometheus监控
prometheus服务端配置prometheus.yml,并重启prometheus容器
metrics_path:定义接口后缀类型,默认为/metrics
即我们输入ip+端口后,浏览器会自动追加/metrics后缀
1
2
3
4
5
6
7
8
9
10
11
vim prometheus.yml ··· scrape_configs: - job_name: "Nginx" metrics_path: '/status/format/prometheus' static_configs: - targets: ['192.168.224.11:8088'] ··· docker restart prometheus 此时进入prometheus管理页面,则能查询nginx的监控项
8.各个监控项的含义 Nginx-module-vts提供了多种监控项,了解监控项含义,有助于帮助自己生成需要的图表
1
2
3
4
5
6
7
8
9
10
11
12
13
14
15
16
17
18
19
20
21
22
23
24
25
26
27
28
29
30
31
32
33
34
35
36
37
38
39
40
41
42
43
44
45
46
47
48
49
50
51
52
53
54
55
56
57
58
59
60
61
62
63
64
65
66
67
68
69
70
71
72
73
74
75
76
77
78
79
80
81
82
83
84
85
86
87
88
89
90
91
92
93
94
95
96
97
98
99
100
101
102
103
104
105
106
107
108
109
110
111
112
113
114
115
116
117
118
119
120
121
122
123
124
125
126
127
128
129
130
131
132
133
134
135
136
137
138
139
140
141
142
143
144
145
146
147
148
149
150
151
152
153
154
155
156
157
158
159
160
161
162
163
164
165
166
167
168
169
170
171
172
173
174
175
176
177
178
179
180
181
182
183
184
185
186
187
188
189
190
# HELP nginx_vts_info Nginx info # TYPE nginx_vts_info gauge nginx_vts_info{hostname="hbhly_21_205",version="1.16.1"} 1 # HELP nginx_vts_start_time_seconds Nginx start time # TYPE nginx_vts_start_time_seconds gauge nginx_vts_start_time_seconds 1584268136.439 # HELP nginx_vts_main_connections Nginx connections # TYPE nginx_vts_main_connections gauge # 区分状态的nginx连接数 nginx_vts_main_connections{status="accepted"} 9271 nginx_vts_main_connections{status="active"} 7 nginx_vts_main_connections{status="handled"} 9271 nginx_vts_main_connections{status="reading"} 0 nginx_vts_main_connections{status="requests"} 438850 nginx_vts_main_connections{status="waiting"} 6 nginx_vts_main_connections{status="writing"} 1 # HELP nginx_vts_main_shm_usage_bytes Shared memory [ngx_http_vhost_traffic_status] info # TYPE nginx_vts_main_shm_usage_bytes gauge # 内存使用量 nginx_vts_main_shm_usage_bytes{shared="max_size"} 1048575 nginx_vts_main_shm_usage_bytes{shared="used_size"} 24689 nginx_vts_main_shm_usage_bytes{shared="used_node"} 7 # HELP nginx_vts_server_bytes_total The request/response bytes # TYPE nginx_vts_server_bytes_total counter # HELP nginx_vts_server_requests_total The requests counter # TYPE nginx_vts_server_requests_total counter # HELP nginx_vts_server_request_seconds_total The request processing time in seconds # TYPE nginx_vts_server_request_seconds_total counter # HELP nginx_vts_server_request_seconds The average of request processing times in seconds # TYPE nginx_vts_server_request_seconds gauge # HELP nginx_vts_server_request_duration_seconds The histogram of request processing time # TYPE nginx_vts_server_request_duration_seconds histogram # HELP nginx_vts_server_cache_total The requests cache counter # TYPE nginx_vts_server_cache_total counter # 分Host的进出流量 nginx_vts_server_bytes_total{host="10.160.21.205",direction="in"} 22921464 nginx_vts_server_bytes_total{host="10.160.21.205",direction="out"} 1098196005 # 分状态码的请求数量统计 1** 2** 3** 4** 5** nginx_vts_server_requests_total{host="10.160.21.205",code="1xx"} 0 nginx_vts_server_requests_total{host="10.160.21.205",code="2xx"} 86809 nginx_vts_server_requests_total{host="10.160.21.205",code="3xx"} 0 nginx_vts_server_requests_total{host="10.160.21.205",code="4xx"} 2 nginx_vts_server_requests_total{host="10.160.21.205",code="5xx"} 0 nginx_vts_server_requests_total{host="10.160.21.205",code="total"} 86811 # 响应时间 nginx_vts_server_request_seconds_total{host="10.160.21.205"} 0.000 nginx_vts_server_request_seconds{host="10.160.21.205"} 0.000 # 分状态的缓存的统计 nginx_vts_server_cache_total{host="10.160.21.205",status="miss"} 0 nginx_vts_server_cache_total{host="10.160.21.205",status="bypass"} 0 nginx_vts_server_cache_total{host="10.160.21.205",status="expired"} 0 nginx_vts_server_cache_total{host="10.160.21.205",status="stale"} 0 nginx_vts_server_cache_total{host="10.160.21.205",status="updating"} 0 nginx_vts_server_cache_total{host="10.160.21.205",status="revalidated"} 0 nginx_vts_server_cache_total{host="10.160.21.205",status="hit"} 0 nginx_vts_server_cache_total{host="10.160.21.205",status="scarce"} 0 nginx_vts_server_bytes_total{host="devapi.feedback.test",direction="in"} 3044526 nginx_vts_server_bytes_total{host="devapi.feedback.test",direction="out"} 41257028 # 分状态的连接数的统计 nginx_vts_server_requests_total{host="devapi.feedback.test",code="1xx"} 0 nginx_vts_server_requests_total{host="devapi.feedback.test",code="2xx"} 3983 nginx_vts_server_requests_total{host="devapi.feedback.test",code="3xx"} 0 nginx_vts_server_requests_total{host="devapi.feedback.test",code="4xx"} 24 nginx_vts_server_requests_total{host="devapi.feedback.test",code="5xx"} 11 nginx_vts_server_requests_total{host="devapi.feedback.test",code="total"} 4018 nginx_vts_server_request_seconds_total{host="devapi.feedback.test"} 327.173 nginx_vts_server_request_seconds{host="devapi.feedback.test"} 0.000 # nginx缓存计算器,精确到状态和type nginx_vts_server_cache_total{host="devapi.feedback.test",status="miss"} 0 nginx_vts_server_cache_total{host="devapi.feedback.test",status="bypass"} 0 nginx_vts_server_cache_total{host="devapi.feedback.test",status="expired"} 0 nginx_vts_server_cache_total{host="devapi.feedback.test",status="stale"} 0 nginx_vts_server_cache_total{host="devapi.feedback.test",status="updating"} 0 nginx_vts_server_cache_total{host="devapi.feedback.test",status="revalidated"} 0 nginx_vts_server_cache_total{host="devapi.feedback.test",status="hit"} 0 nginx_vts_server_cache_total{host="devapi.feedback.test",status="scarce"} 0 nginx_vts_server_bytes_total{host="testapi.feedback.test",direction="in"} 55553573 nginx_vts_server_bytes_total{host="testapi.feedback.test",direction="out"} 9667561188 nginx_vts_server_requests_total{host="testapi.feedback.test",code="1xx"} 0 nginx_vts_server_requests_total{host="testapi.feedback.test",code="2xx"} 347949 nginx_vts_server_requests_total{host="testapi.feedback.test",code="3xx"} 31 nginx_vts_server_requests_total{host="testapi.feedback.test",code="4xx"} 7 nginx_vts_server_requests_total{host="testapi.feedback.test",code="5xx"} 33 nginx_vts_server_requests_total{host="testapi.feedback.test",code="total"} 348020 nginx_vts_server_request_seconds_total{host="testapi.feedback.test"} 2185.177 nginx_vts_server_request_seconds{host="testapi.feedback.test"} 0.001 nginx_vts_server_cache_total{host="testapi.feedback.test",status="miss"} 0 nginx_vts_server_cache_total{host="testapi.feedback.test",status="bypass"} 0 nginx_vts_server_cache_total{host="testapi.feedback.test",status="expired"} 0 nginx_vts_server_cache_total{host="testapi.feedback.test",status="stale"} 0 nginx_vts_server_cache_total{host="testapi.feedback.test",status="updating"} 0 nginx_vts_server_cache_total{host="testapi.feedback.test",status="revalidated"} 0 nginx_vts_server_cache_total{host="testapi.feedback.test",status="hit"} 0 nginx_vts_server_cache_total{host="testapi.feedback.test",status="scarce"} 0 nginx_vts_server_bytes_total{host="*",direction="in"} 81519563 nginx_vts_server_bytes_total{host="*",direction="out"} 10807014221 # 分host请求数量统计 nginx_vts_server_requests_total{host="*",code="1xx"} 0 nginx_vts_server_requests_total{host="*",code="2xx"} 438741 nginx_vts_server_requests_total{host="*",code="3xx"} 31 nginx_vts_server_requests_total{host="*",code="4xx"} 33 nginx_vts_server_requests_total{host="*",code="5xx"} 44 nginx_vts_server_requests_total{host="*",code="total"} 438849 nginx_vts_server_request_seconds_total{host="*"} 2512.350 nginx_vts_server_request_seconds{host="*"} 0.007 # 分host缓存统计 nginx_vts_server_cache_total{host="*",status="miss"} 0 nginx_vts_server_cache_total{host="*",status="bypass"} 0 nginx_vts_server_cache_total{host="*",status="expired"} 0 nginx_vts_server_cache_total{host="*",status="stale"} 0 nginx_vts_server_cache_total{host="*",status="updating"} 0 nginx_vts_server_cache_total{host="*",status="revalidated"} 0 nginx_vts_server_cache_total{host="*",status="hit"} 0 nginx_vts_server_cache_total{host="*",status="scarce"} 0 # HELP nginx_vts_upstream_bytes_total The request/response bytes # TYPE nginx_vts_upstream_bytes_total counter # HELP nginx_vts_upstream_requests_total The upstream requests counter # TYPE nginx_vts_upstream_requests_total counter # HELP nginx_vts_upstream_request_seconds_total The request Processing time including upstream in seconds # TYPE nginx_vts_upstream_request_seconds_total counter # HELP nginx_vts_upstream_request_seconds The average of request processing times including upstream in seconds # TYPE nginx_vts_upstream_request_seconds gauge # HELP nginx_vts_upstream_response_seconds_total The only upstream response processing time in seconds # TYPE nginx_vts_upstream_response_seconds_total counter # HELP nginx_vts_upstream_response_seconds The average of only upstream response processing times in seconds # TYPE nginx_vts_upstream_response_seconds gauge # HELP nginx_vts_upstream_request_duration_seconds The histogram of request processing time including upstream # TYPE nginx_vts_upstream_request_duration_seconds histogram # HELP nginx_vts_upstream_response_duration_seconds The histogram of only upstream response processing time # TYPE nginx_vts_upstream_response_duration_seconds histogram # 分upstream流量统计 nginx_vts_upstream_bytes_total{upstream="::nogroups",backend="10.144.227.162:80",direction="in"} 12296 nginx_vts_upstream_bytes_total{upstream="::nogroups",backend="10.144.227.162:80",direction="out"} 13582924 nginx_vts_upstream_requests_total{upstream="::nogroups",backend="10.144.227.162:80",code="1xx"} 0 nginx_vts_upstream_requests_total{upstream="::nogroups",backend="10.144.227.162:80",code="2xx"} 25 nginx_vts_upstream_requests_total{upstream="::nogroups",backend="10.144.227.162:80",code="3xx"} 0 nginx_vts_upstream_requests_total{upstream="::nogroups",backend="10.144.227.162:80",code="4xx"} 0 nginx_vts_upstream_requests_total{upstream="::nogroups",backend="10.144.227.162:80",code="5xx"} 0 nginx_vts_upstream_requests_total{upstream="::nogroups",backend="10.144.227.162:80",code="total"} 25 nginx_vts_upstream_request_seconds_total{upstream="::nogroups",backend="10.144.227.162:80"} 1.483 nginx_vts_upstream_request_seconds{upstream="::nogroups",backend="10.144.227.162:80"} 0.000 nginx_vts_upstream_response_seconds_total{upstream="::nogroups",backend="10.144.227.162:80"} 1.484 nginx_vts_upstream_response_seconds{upstream="::nogroups",backend="10.144.227.162:80"} 0.000 nginx_vts_upstream_bytes_total{upstream="::nogroups",backend="10.152.218.149:80",direction="in"} 12471 nginx_vts_upstream_bytes_total{upstream="::nogroups",backend="10.152.218.149:80",direction="out"} 11790508 nginx_vts_upstream_requests_total{upstream="::nogroups",backend="10.152.218.149:80",code="1xx"} 0 nginx_vts_upstream_requests_total{upstream="::nogroups",backend="10.152.218.149:80",code="2xx"} 24 nginx_vts_upstream_requests_total{upstream="::nogroups",backend="10.152.218.149:80",code="3xx"} 0 nginx_vts_upstream_requests_total{upstream="::nogroups",backend="10.152.218.149:80",code="4xx"} 0 nginx_vts_upstream_requests_total{upstream="::nogroups",backend="10.152.218.149:80",code="5xx"} 0 nginx_vts_upstream_requests_total{upstream="::nogroups",backend="10.152.218.149:80",code="total"} 24 nginx_vts_upstream_request_seconds_total{upstream="::nogroups",backend="10.152.218.149:80"} 1.169 nginx_vts_upstream_request_seconds{upstream="::nogroups",backend="10.152.218.149:80"} 0.000 nginx_vts_upstream_response_seconds_total{upstream="::nogroups",backend="10.152.218.149:80"} 1.168 nginx_vts_upstream_response_seconds{upstream="::nogroups",backend="10.152.218.149:80"} 0.000 nginx_vts_upstream_bytes_total{upstream="::nogroups",backend="10.160.21.205:8081",direction="in"} 3036924 nginx_vts_upstream_bytes_total{upstream="::nogroups",backend="10.160.21.205:8081",direction="out"} 33355357 nginx_vts_upstream_requests_total{upstream="::nogroups",backend="10.160.21.205:8081",code="1xx"} 0 nginx_vts_upstream_requests_total{upstream="::nogroups",backend="10.160.21.205:8081",code="2xx"} 3971 nginx_vts_upstream_requests_total{upstream="::nogroups",backend="10.160.21.205:8081",code="3xx"} 0 nginx_vts_upstream_requests_total{upstream="::nogroups",backend="10.160.21.205:8081",code="4xx"} 24 nginx_vts_upstream_requests_total{upstream="::nogroups",backend="10.160.21.205:8081",code="5xx"} 11 nginx_vts_upstream_requests_total{upstream="::nogroups",backend="10.160.21.205:8081",code="total"} 4006 nginx_vts_upstream_request_seconds_total{upstream="::nogroups",backend="10.160.21.205:8081"} 326.427 nginx_vts_upstream_request_seconds{upstream="::nogroups",backend="10.160.21.205:8081"} 0.000 nginx_vts_upstream_response_seconds_total{upstream="::nogroups",backend="10.160.21.205:8081"} 300.722 nginx_vts_upstream_response_seconds{upstream="::nogroups",backend="10.160.21.205:8081"} 0.000 nginx_vts_upstream_bytes_total{upstream="::nogroups",backend="10.160.21.205:8082",direction="in"} 55536408 nginx_vts_upstream_bytes_total{upstream="::nogroups",backend="10.160.21.205:8082",direction="out"} 9650089427 nginx_vts_upstream_requests_total{upstream="::nogroups",backend="10.160.21.205:8082",code="1xx"} 0 nginx_vts_upstream_requests_total{upstream="::nogroups",backend="10.160.21.205:8082",code="2xx"} 347912 nginx_vts_upstream_requests_total{upstream="::nogroups",backend="10.160.21.205:8082",code="3xx"} 31 nginx_vts_upstream_requests_total{upstream="::nogroups",backend="10.160.21.205:8082",code="4xx"} 7 nginx_vts_upstream_requests_total{upstream="::nogroups",backend="10.160.21.205:8082",code="5xx"} 33 nginx_vts_upstream_requests_total{upstream="::nogroups",backend="10.160.21.205:8082",code="total"} 347983 nginx_vts_upstream_request_seconds_total{upstream="::nogroups",backend="10.160.21.205:8082"} 2183.271 nginx_vts_upstream_request_seconds{upstream="::nogroups",backend="10.160.21.205:8082"} 0.001 nginx_vts_upstream_response_seconds_total{upstream="::nogroups",backend="10.160.21.205:8082"} 2180.893 nginx_vts_upstream_response_seconds{upstream="::nogroups",backend="10.160.21.205:8082"} 0.001
9.Prometheus UI中Target表达式查询 1)CAdvisor中获取的典型监控指标
指标名称
类型
含义
container_cpu_load_average_10s
gauge
过去10秒内容器CPU的平均负载
container_cpu_usage_seconds_total
counter
容器在每个CPU内核上的累积占用时间 (单位:秒)
container_cpu_system_seconds_total
counter
System CPU累积占用时间(单位:秒)
container_cpu_user_seconds_total
counter
User CPU累积占用时间(单位:秒)
container_fs_usge_bytes
gauge
容器中文件系统的使用量(单位:字节)
container_network_receive_bytes_total
counter
容器网络累计接受数据总量(单位: 字节)
container_network_transmit_bytes_total
counter
容器网络累计传输数据总量(单位: 字节)
2)容器相关
1
2
3
4
5
6
7
8
9
10
11
12
13
14
15
16
17
# 容器的CPU使用率 sum(irate(container_cpu_usage_seconds_total{image!=""}[1m])) without (cpu) # 容器内存使用量(单位: 字节) container_memory_usage_bytes{image!=""} # 容器网络接收量速率(单位: 字节/秒) sum(rate(container_network_receive_bytes_total{image!=""}[1m])) without (interface) # 容器网络传输量速率 sum(rate(container_network_transmit_bytes_total{image!=""}[1m])) without (interface) # 容器文件系统读取速率 sum(rate(container_fs_reads_bytes_total{image!=""}[1m])) without (device) # 容器文件系统写入速率(单位: 字节/秒) sum(rate(container_fs_writes_bytes_total{image!=""}[1m])) without (device)
3)http相关
1
2
3
4
5
6
7
8
9
10
11
12
13
14
15
16
17
18
19
20
# HTTP请求总数 prometheus_http_requests_total # HTTP请求持续时间秒桶 prometheus_http_request_duration_seconds_bucket # HTTP请求持续时间秒数计数 prometheus_http_request_duration_seconds_count # HTTP请求持续时间秒数之和 prometheus_http_request_duration_seconds_sum # HTTP响应大小字节 prometheus_http_response_size_bytes_bucket # HTTP响应大小字节计数计数 prometheus_http_response_size_bytes_count # HTTP响应大小字节的总和 prometheus_http_response_size_bytes_sum
4)Nginx相关
1
2
3
4
5
6
7
8
9
10
11
12
13
14
15
16
17
18
19
20
21
22
23
24
25
26
27
28
29
30
31
32
33
34
35
36
37
38
39
40
41
# Nginxvts过滤字节总数 nginx_vts_filter_bytes_total # Nginx VTS过滤器缓存总数 nginx_vts_filter_cache_total # Nginx VTS过滤请求秒数 nginx_vts_filter_request_seconds # Nginx VTS过滤器请求总秒数 nginx_vts_filter_request_seconds_total # Nginx VTS过滤器请求总数 nginx_vts_filter_requests_total # nginx信息 nginx_vts_info # Nginx VTS主连接 nginx_vts_main_connections # Nginx VTS主SHM使用字节 nginx_vts_main_shm_usage_bytes # Nginx VTS服务器字节总数 nginx_vts_server_bytes_total # Nginx VTS服务器缓存总数 nginx_vts_server_cache_total # Nginx_vts服务器请求秒 nginx_vts_server_request_seconds # Nginx_vts服务器请求总秒数 nginx_vts_server_request_seconds_total # Nginx_vts服务总请求数 nginx_vts_server_requests_total # Nginx VTS开始时间秒数 nginx_vts_start_time_seconds
10.安装blackbox_exporter
blackbox收集服务状态信息,如判断服务http请求是否返回200继而报警
blackbox_exporter是Prometheus 官方提供的 exporter 之一,可以提供 http、dns、tcp、icmp 的监控数据采集
1
2
3
4
5
6
7
8
9
10
11
12
13
14
15
16
17
18
19
20
21
22
23
24
25
26
27
28
29
30
31
32
33
34
35
36
37
38
39
40
41
42
43
44
45
46
功能: HTTP 测试 定义 Request Header 信息 判断 Http status / Http Respones Header / Http Body 内容 TCP 测试 业务组件端口状态监听 应用层协议定义与监听 ICMP 测试 主机探活机制 POST 测试 接口联通性 SSL 证书过期时间 # 下载、解压 wget https://github.com/prometheus/blackbox_exporter/releases/download/v0.14.0/blackbox_exporter-0.14.0.linux-amd64.tar.gz tar -xvf blackbox_exporter-0.14.0.linux-amd64.tar.gz mv blackbox_exporter-0.14.0.linux-amd64 /usr/local/blackbox_exporter # 查看安装是否成功 /usr/local/blackbox_exporter/blackbox_exporter --version blackbox_exporter, version 0.14.0 (branch: HEAD, revision: bba7ef76193948a333a5868a1ab38b864f7d968a) build user: root@63d11aa5b6c6 build date: 20190315-13:32:31 go version: go1.11.5 # 加入systemd管理 vim /usr/lib/systemd/system/blackbox_exporter.service [Unit] Description=blackbox_exporter [Service] User=root Type=simple ExecStart=/usr/local/blackbox_exporter/blackbox_exporter --config.file=/usr/local/blackbox_exporter/blackbox.yml Restart=on-failure # 启动 systemctl daemon-reload systemctl enable --now blackbox_exporter
二,通过官网源码解压安装 1.安装Prometheus_server
去官网下载prometheus.io
1 wget https://github.com/prometheus/prometheus/releases/download/v2.43.0/prometheus-2.43.0.linux-amd64.tar.gz
prometheus的安装非常简单
1
2
tar xzf prometheus-2.43.0.linux-amd64.tar.gz cp -rf prometheus-2.43.0.linux-amd64 /usr/local/prometheus
Prometheus 启动和后台运行
1
2
3
4
5
6
7
8
9
10
cd /usr/local/prometheus/ ./prometheus 通过tmux运行程序。 tmux ./prometheus Ctrl+b +d 退出当前窗口 tmux a 进入a窗口
第二种加入后台启动的方式
daemonize Unix系统后台守护进程管理软件
优点:更加正规 后台运行更稳定
1
2
3
4
5
6
7
git clone git://github.com/bmc/daemonize.git sh configure && make && sudo make install daemonize -c /data/prometheus/ /data/prometheus/up.sh -c 是指定运行路径 /data/prometheus/up.sh是运行路径下的一个启动脚本
下面就是这个启动脚本的内容
内容:就是开启prometheus进程
1
2
3
4
5
6
7
8
9
10
11
12
13
14
15
16
cat /data/prometheus/up.sh /data/prometheus/prometheus --web.listen-address="0.0.0.0:9090" --web.read-timeout=5m --web.max-connections=10 --storage.tsdb.retention=15d --storage.tsdb.path="data/" --query.max-concurrency=20 --query.timeout=2m 参数解释 --web.read-timeout=5m 请求链接的最大等待时间,防止太多的空闲链接,占用资源 --storage.tsdb.retention=15d prometheus开始采集监控数据之后,会存在内存中和硬盘中,对于保留期限的设置很重要,太长的话,硬盘和内存都吃不消,太短的话,要查历史数据就没有了,企业中设置15天为宜。 --storage.tsdb.path="data/" 存储数据路径,这个也很重要,不要随便放在一个地方就执行,会把/跟目录塞满了。 --query.timeout=2m --query.max-concurrency=20 这两项是对用户执行prometheus查询时候的优化设置 防止太多的用户同时查询,也防止单个用户执行过大的查询而一直不退出。 配置以上参数后,prometheus运行就相对稳妥多了。
第三种加入后台启动的方式(推荐)
创建一个专门的prometheus用户
1 useradd -M -s /usr/sbin/nologin prometheus
更改prometheus用户的文件夹权限
1 chown prometheus:prometheus -R /usr/local/prometheus/
创建systemd服务
1
2
3
4
5
6
7
8
9
10
11
[Unit]Description=prometheus Documentation=https://prometheus.io/ After=network.target [Service] Type=simple User=prometheus Group=prometheus ExecStart=/usr/local/prometheus/prometheus --config.file=/usr/local/prometheus/prometheus.yml --storage.tsdb.path=/usr/local/prometheus/data --web.enable-lifecycle --storage.tsdb.retention=30d Restart=on-failure [Install] WantedBy=multi-user.target
加载
1
2
3
systemctl daemon-reload 启动 systemctl start prometheus.service
然后,看下 ./prometheus 在实际企业运行是启动参数的合理配置。
1 ps -ef | grep prometheus
之后默认运行在9090端口
浏览器可以直接打开访问,无账号密码验证(如果希望加上验证,可以使用类似apache httppass方式添加)
http://192.168.224.11:9090/graph
监控指标
http://192.168.224.11:9090/metrics
接下来看一下Prometheus的主配置文件
prometheus解压安装之后,就默认自带了一个基本的配置文件如下
1 vim /usr/local/prometheus/prometheus.yml
配置文件的大致内容
1
2
3
4
5
6
7
8
9
10
11
12
13
14
15
16
17
18
19
20
21
22
23
# my global config global: scrape_interval: 15s # Set the scrape interval to every 15 seconds. Default is every 1 minute. evaluation_interval: 15s # Evaluate rules every 15 seconds. The default is every 1 minute. # scrape_timeout is set to the global default (10s). 前面两个是全局变量 scrape_interval 抓取采样数据的时间,默认是15秒去被监控机采样一次, 这个就是prometheus的自定义数据采集频率了。 evaluation_interval 监控数据规则的评估率。 这个参数是prometheus多长时间会进行一次监控规则评估。 比如设置 当内存使用量>70%时,发出警报,这么一条rule(规则),那么prometheus会默认每15秒来执行一次这个规则,检查内存的情况。 # Alertmanager configuration alerting: alertmanagers: - static_configs: - targets: # - alertmanager:9093 Alertmanager 是prometheus的一个用于管理和发出报警的插件 我采用的是4.0以上版本的Grafana,本身就已经支持报警发出功能了。
再往后就是prometheus重要的配置采集节点的设置
1
2
3
4
5
6
7
8
9
10
11
12
13
14
15
16
17
18
19
20
21
22
# Here it's Prometheus itself. scrape_configs: # The job name is added as a label `job=<job_name>` to any timeseries scraped from this config. - job_name: "prometheus" # metrics_path defaults to '/metrics' # scheme defaults to 'http'. static_configs: - targets: ["localhost:9090"] 先定义一个job的名称 - job_name: "prometheus" 然后定义监控节点targets # metrics_path defaults to '/metrics' # scheme defaults to 'http'. static_configs: - targets: ["localhost:9090"]
-targets 的设定
以这种形式设定默认带了一个prometheus本机的
1
2
3
static_configs: - targets:['localhost:9090'
这里可以继续扩展加入其他需要被监控的节点
比如:
1
2
3
- job_name: 'aliyun' static_config: - targets:['server04:9100','web3:9100','nginx06:9100','web07:9100','redis07:9100','log:9100','redis02:9100']
targets可以并列写入多个节点,用逗号隔开,机器名+端口号
端口号:通常用的就是exporters的端口,这里的9100就是node_exporter的默认端口。
如此prometheus就可以通过配置文件识别监控的节点,持续采集数据。
prometheus到此就算初步搭建好了。
光搭建好prometheus_server是不够的,我们需要给监控节点搭建一个exporter用来采集数据,选用企业中最常用的node_exporter这个插件。
node_exporter是一个以http_server方式运行在后台,并且持续采集linux系统中各种操作系统本身相关的监控参数的程序,其采集量是很大很全的,往往默认的采集项目就远超过你的实际需求。
2.安装alermanager 从官网下载
1
2
3
4
5
6
7
8
9
10
https://prometheus.io/download/ wget https://github.com/prometheus/alertmanager/releases/download/v0.25.0/alertmanager-0.25.0.linux-amd64.tar.gz 解压 tar xzf alertmanager-0.25.0.linux-amd64.tar.gz mv alertmanager-0.25.0.linux-amd64 /usr/local/alertmanager 授权 chown -R prometheus.prometheus /usr/local/alertmanager/
创建systemd服务
1
2
3
4
5
6
7
8
9
10
11
12
13
14
15
16
17
18
19
20
cat >/etc/systemd/system/alertmanager.service << "EOF" [Unit] Description=Alert Manager Wants=network-online.target After=network-online.target [Service] Type=simple User=prometheus Group=prometheus ExecStart=/usr/local/alertmanager/alertmanager \ --config.file=/usr/local/alertmanager/alertmanager.yml \ --storage.path=/usr/local/alertmanager/data Restart=always [Install] WantedBy=multi-user.target EOF
启动alertmanager
1
2
3
systemctl daemon-reload systemctl start alertmanager.service systemctl status alertmanager.service
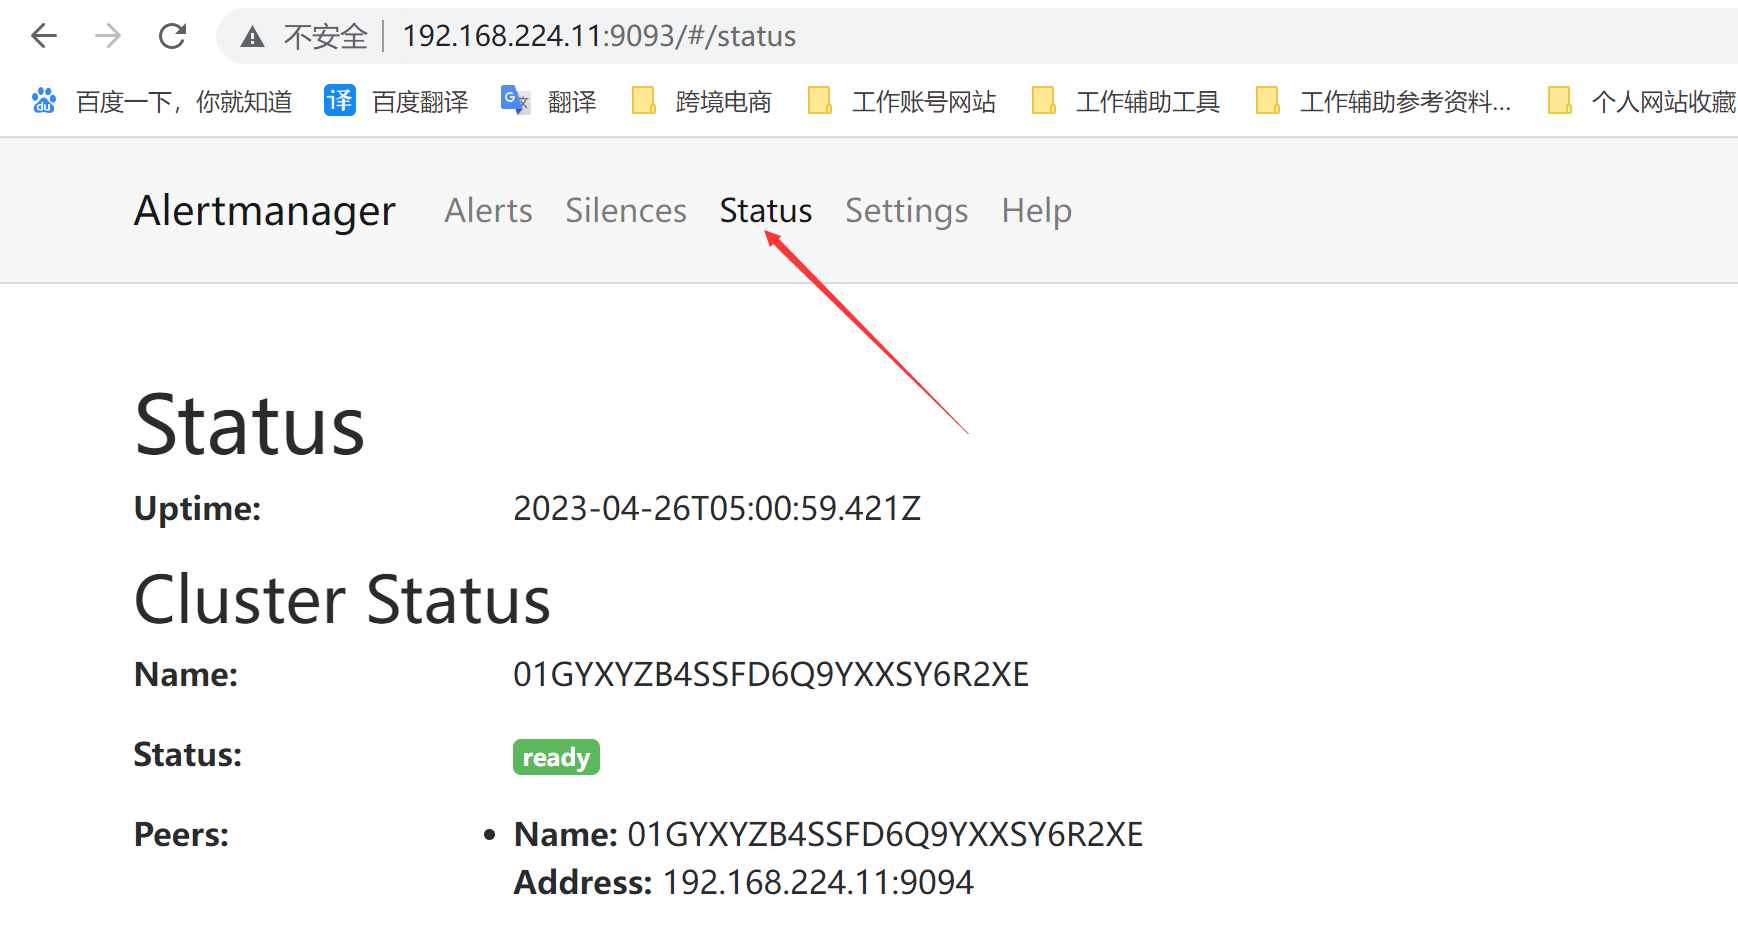
访问端口
1 http://192.168.224.11:9093/#/alerts
修改prometheus配置
加入alertmanager
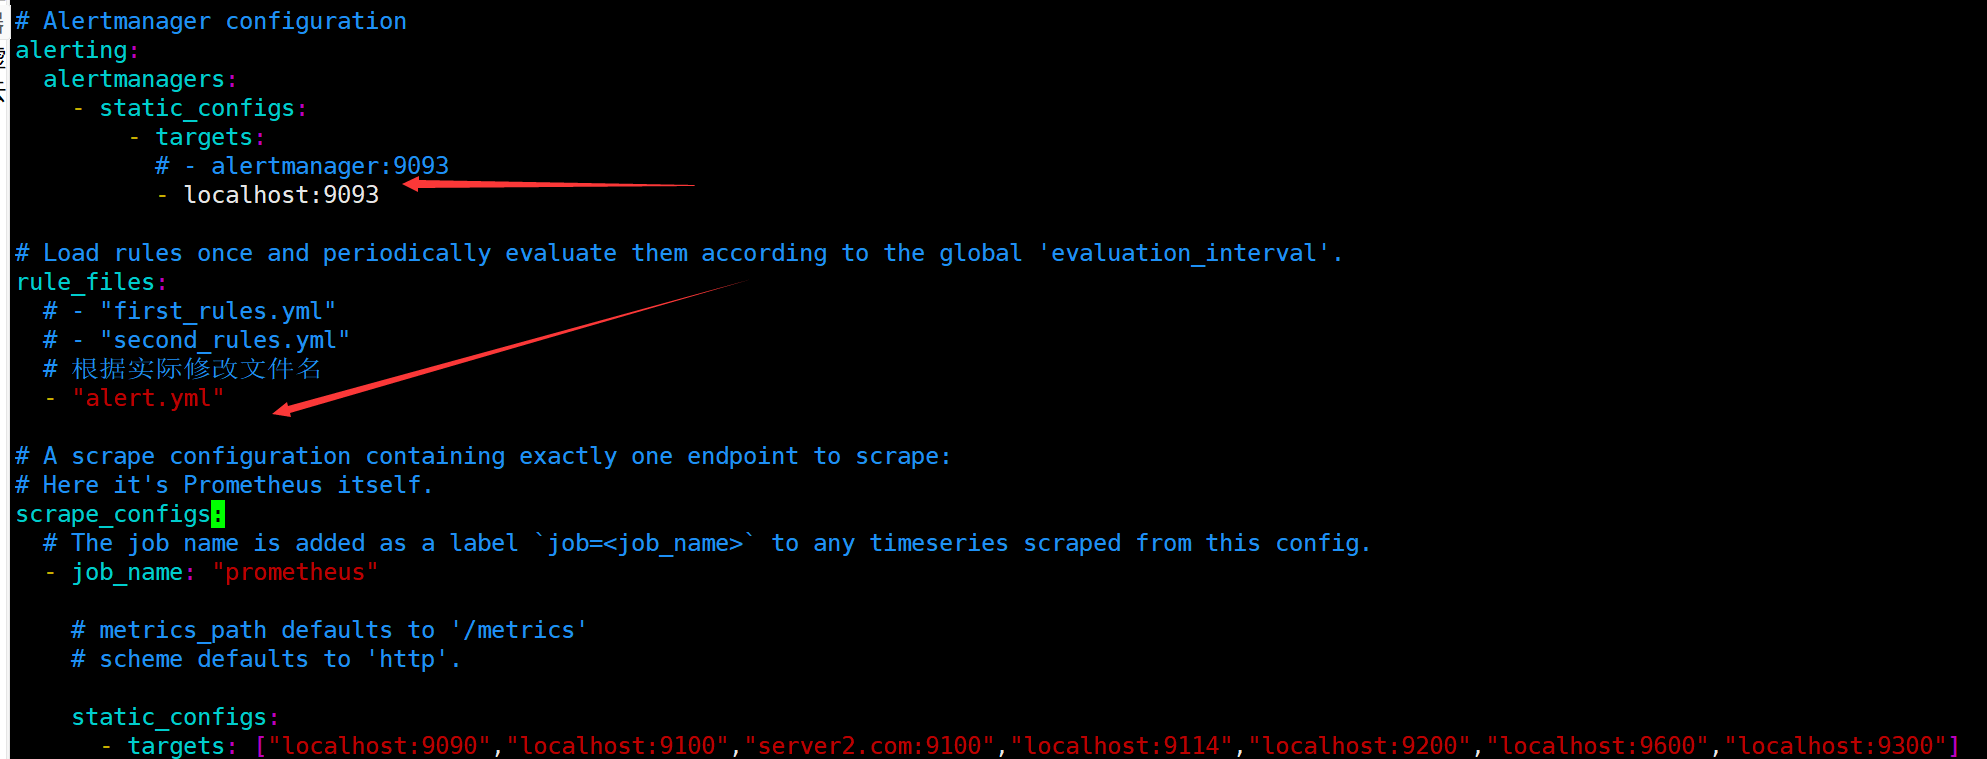
1
2
3
4
5
6
7
8
9
10
11
12
13
14
15
# Alertmanager configuration alerting: alertmanagers: - static_configs: - targets: # - alertmanager:9093 - localhost:9093 # Load rules once and periodically evaluate them according to the global 'evaluation_interval'. rule_files: # - "first_rules.yml" # - "second_rules.yml" # 根据实际修改文件名 - "alert.yml"
增加触发器配置文件
1
2
3
4
5
6
7
8
9
10
11
12
13
14
cat > /usr/local/prometheus/alert.yml <<"EOF" groups: - name: Prometheus alert rules: #对任何实例超过30s无法联系的情况发出警报 - alert: 服务器告警 expr: up == 0 for: 30s labels: severity: critical annotations: instance: "{{ $labels.instance }}" description: "{{ $labels.job }} 服务关闭" EOF
检查配置
1
2
cd /usr/local/prometheus/ ./promtool check config prometheus.yml
重启prometheus或者重载
1
2
3
systemctl restart prometheus.service 或者重载,需要--web.enable-lifecycle配置 curl -X POST http://localhost:9090/-/reload
访问地址
1 http://192.168.224.11:9093/#/alerts
检查
3.安装node_exporter 从官网下载
1
2
3
4
5
6
7
8
9
10
11
12
13
14
15
16
17
18
19
wget https://github.com/prometheus/node_exporter/releases/download/v1.5.0/node_exporter-1.5.0.linux-amd64.tar.gz 解压 tar xzf node_exporter-1.5.0.linux-amd64.tar.gz cp -rf node_exporter-1.5.0.linux-amd64 /usr/local/node_exporter 更改 node_exporter文件权限 chown -R prometheus.prometheus /usr/local/node_exporter/ tmux 进入新终端 cd /usr/local/node_exporter ./node_exporter tmux ls 查看已创建的会话终端 tmux a -t 2 进入一个会话,名为2 查看是否运行起来了。 node_exporter]# netstat -putnal | grep node tcp6 0 0 :::9100 :::* LISTEN 64349/./node_export
创建systemd服务
1
2
3
4
5
6
7
8
9
10
11
12
13
14
15
16
cat >/etc/systemd/system/node_exporter.service << "EOF" [Unit] Description=node_exporter Documentation=https://prometheus.io/ After=network.target [Service] User=prometheus Group=prometheus ExecStart=/usr/local/node_exporter/node_exporter Restart=on-failure [Install] WantedBy=multi-user.target EOF
启动node_exporter
1
2
3
4
systemctl daemon-reload systemctl start node_exporter.service systemctl status node_exporter.service systemctl enable node_exporter.service
检查日志
1 journalctl -u node_exporter.service -f
修改promethsu.yml配置
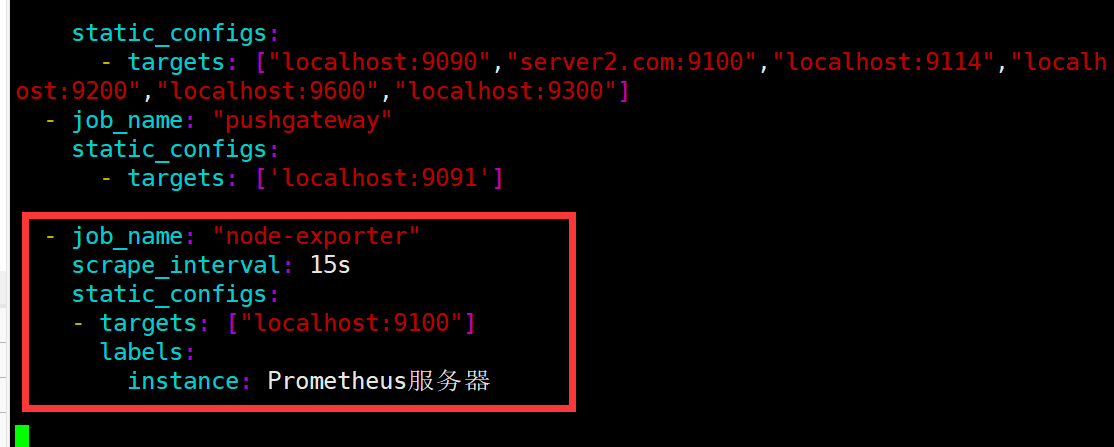
1
2
3
4
5
6
- job_name: "node-exporter" scrape_interval: 15s static_configs: - targets: ["localhost:9100"] labels: instance: Prometheus服务器
重载prometheus
1
2
3
systemctl restart prometheus 或者 curl -X POST http://localhost:9090/-/reload
可以看到node_exporter默认端口是9100
可以响应prometheus_server发过来的http_get请求,
也可以响应其他方式的http_get请求
可以发送测试
1 curl localhost:9100/metrics
执行curl 之后,我们看到node_exporter给我们返回了大量的这种metrics类型K/V数据,
这些返回的K/V数据,其中的Key的名称就可以直接复制粘贴在prometheus的查询命令行来查看结果了。
比如查看这一项 node_menory_MemFree
1
2
3
4
curl localhost:9100/metrics |grep node_menory_MemFree % Total % Received % Xferd Average Speed Time Time Time Current Dload Upload Total Spent Left Speed 100 70942 0 70942 0 0 2804k 0 --:--:-- --:--:-- --:--:-- 2886k
也可以在后台才看,比如我查看其他信息
直接看到曲线了,
prometheus对Linux CPU的采集并不是直接给我们返回一个现成的CPU百分比,而是返回linux中很底层的cpu时间线累积的数值的这样一个数据(我们平时用惯 了top/uptime这种简便的方式查看CPU使用率,往往浅尝,根本没有好好深入理解,所谓的CPU使用率在linux中到底是怎么回事,)
其实,如果想真的弄明白CPU的使用率这个概念,在linux中,要先从CPU时间这概念开始建立,linux中CPU时间实际是指,从操作系统开启算起CPU就开始工作了,并记录自己在工作中总共使用的”时间”的累积量把他保存在系统中,而累积的CPU使用时间还会分成几个重要的状态类型。
比如CPU time=>分成 CPU user time / sys time / nice time / idle time / irq/等等。
翻译过来就是CPU用户态使用时间,系统/内核态使用时间,nice值分配使用时间,空闲时间,中断时间等等。
所谓的cpu使用率是什么意思呢。
CPU使用率最准确的定义其实就是CPU各种状态中除了idle(空闲)这个状态外,其他所有 的CPU状态加合/总的CPU时间得出来得就是我们所说的CPU使用率。
所以:如果在prometheus中想对CPU的使用率准确的来查询
正确的方法如下:
1
2
3
(1-((sum(increase(node_cpu{mode="idle"}[1m]))by(instance))/(sum(increase(node_cpu[1m]))by(instance))))*100 (1-((sum(increase(node_cpu_seconds_total{mode="idle"}[1m]))by(instance))/(sum(increase(node_cpu_seconds_total[1m]))by(instance)))) * 100
prometheus这种底层数据采集所形成的监控,其实是最准确最可信的。
prometheus本身也逼着使用它的运维同学,不踏实下来,好好真正的把linux技术学过关的话,就没有办法使用好这个超强力的监控工具了。
三, prometheus的使用 指标(Metric)的四种类型
Prometheus底层存储上其实并没有对指标做类型区分,都是以时间序列形式存储,但为了方便用户的使用和理解不同监控指标之间的差异,Prometheus定义理论counter(计数器)、gauge(仪表盘)、histogram(直方图)、以及summary(摘要)这4中Metrics类型。
Exporter插件来源 社区提供的
1 https://prometheus.io/docs/instrumenting/exporters/
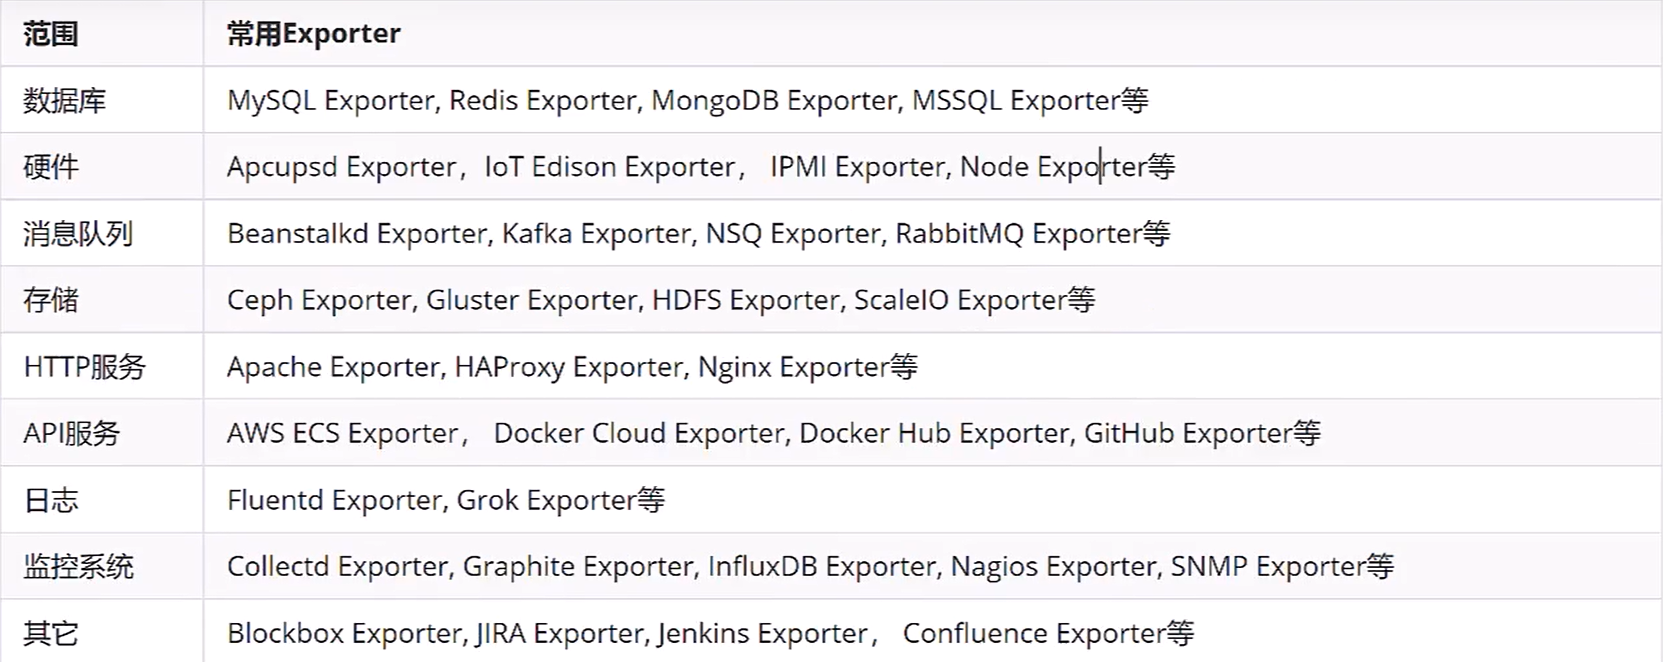
Prometheus社区提供了丰富的Exporter实现,覆盖了从基础设施,中间件以及网络等各方面的监控功能。这些exporter可以实现大部分通用的监控需求,下面是一些常用的exporter.
prometheus计算CPU的使用率算法 12点开机后一直到12:30截止
这30分钟的过程中(当前暂时忽略是几核CPU,就当做1核来说)
CPU被使用在用户态的时间一共是8分钟
CPU被使用在内核态的时间一共是1.5分钟
CPU被使用在IO等待状态的时间一共是0.5分钟
CPU被使用在Idle(空闲状态)的时间一共是20分钟
CPU被使用在其他几个状态的时间是0
CPU的使用率=(所有非空闲状态的CPU使用时间总和) / (所有状态CPU时间的总和)
1
2
3
(user(8mins)+sys(1.5mins)+iowa(0.5min)+0+0+0+0) / (30mins) =10分钟/30分钟 =30%
更简明的算法
1
2
3
idle(20mins) / (30mins) = 70% 空闲时间除以总时间等于空闲CPU的比例 100%-70%= 30%
上面这样的方法去计算最终只能算出CPU在30分钟内的总平均时间
如果要计算某一分钟之内CPU的总平均时间是多少??
node_cpu给我们返回的是Counter的数据。Counter是一个一直持续增长的数值
现在面临的问题是30分钟内CPU使用时间持续增长,我们需要截取其中一段增长的增量值,如果我们能获取1分钟的增量值,然后拿这个数值再去使用刚才同样的计算公式,就能得到1分钟的平均值了。
promeheus的数学查询命令行其实给我们提供了非常丰富的计算函数,
increase()
increase函数在prometheus中,是用来针对Counter这种持续增长的数值,截取其中一段时间的增量
increase(node_cpu[1m]) 这样就获取了CPU总使用时间在一分钟内的增量
实际工作中的CPU大多数都是多核的
node_exporter给我们采集的数据也是细到采集到每一个核的CPU时间
我们在实际监控中,往往并不是太关注每一个CPU核表现时间如何,而是希望知道整个CPU表现如何
如果每一个核都单独来监控曲线图意义不大,而且看着比较混乱。
如何解决这个问题。
prometheus提供了另一个sum()函数。
sum()就如其字面意思一样,起到加合的作用。
sum(increase(node_cpu[1m]))
外面套用一个sum即可把所有核数加合问题就可以解决了。
然后把prometheus计算公式在下一个阶段进行拆分讲解
拆分并解释这个运行公式
1 (1-((sum(increase(node_cpu_seconds_total{mode="idle"}[1m]))by(instance))/(sum(increase(node_cpu_seconds_total[1m]))by(instance)))) * 100
这个prometheus的计算公式其实就是那个使用100%-(空闲时间/总时间)的方法,不过这个公式直接拿来看还是比较痛苦,来学一下拆分
首先第一步 ,
node_cpu_seconds_total是我们需要使用的key name
直接输入后如上图所示,目前这种图没有任何意义,我们继续完善命令行
第二步
把idle的CPU时间和全部CPU时间都给过滤出来使用{}做过滤
1 node_cpu_seconds_total{mode="idle"}
第三步
使用increase( [1m]) 把node_cpu_seconds_total{mode=”idle”}包起来
1 increase(node_cpu_seconds_total{mode="idle"}[1m])
这样就把一分钟的增量的CPU时间给取出来了。
第四步
使用sum()再包一层。
1 sum(increase(node_cpu_seconds_total{mode="idle"}[1m]))
现在sum函数不光把每一台机器的多个核加在一起了,还把所有的机器CPU也全都加到一起了,变成了服务器集群总CPU平均值了。如何解决。看下一步。
第五步
新的一个函数
by(instance)
这个函数可以把sum加合到一起的数值按照指定的一个方式进行一层拆分
instance代表的是机器名
意思就是说把sum函数中服务器加合的这个糗事再给它强行拆分出来。
1 sum(increase(node_cpu_seconds_total{mode="idle"}[1m])) by(instance)
这下3个问题都解决了。现在把公式写完整
1
2
3
4
5
6
7
(1-((sum(increase(node_cpu_seconds_total{mode="idle"}[1m])) by(instance)) /(sum(increase(node_cpu_seconds_total[1m])) by (instance)))) * 100 sum(increase(node_cpu_seconds_total{mode="idle"}[1m])) by(instance) 是空闲CPU时间,1分钟的增量 sum(increase(node_cpu_seconds_total[1m])) by(instance) 是全部CPU时间,1分钟的增量。 sum(increase(node_cpu_seconds_total{mode="idle"}[1m])) by(instance) /sum(increase(node_cpu_seconds_total[1m])) by(instance)
这样就得到了空闲CPU的百分比了。
第七步
最后一步用1去减掉整个上面的公式再 *100
这样就得到了我们期望的结果
1 (1-((sum(increase(node_cpu_seconds_total{mode="idle"}[1m])) by(instance)) /(sum(increase(node_cpu_seconds_total[1m])) by (instance)))) * 100
查看其他CPU状态时间的使用率
既然要看每一个单独CPU类型的使用率,那么1-idle的方式就不好用了
1
2
3
4
5
sum(increase(node_cpu_seconds_total{mode="user"}[1m])) by(instance) /sum(increase(node_cpu_seconds_total[1m])) by (instance) sum(increase(node_cpu_seconds_total{mode="system"}[1m])) by(instance) /sum(increase(node_cpu_seconds_total[1m])) by (instance) sum(increase(node_cpu_seconds_total{mode="iowait"}[1m])) by(instance) /sum(increase(node_cpu_seconds_total[1m])) by (instance)
这样就可以获取每一种CPU状态时间的使用百分比了。
现在发现TOP命令的这一行,我们就能明白是怎么回事了。
prometheus命令行使用扩展 1.prometheus命令格式
这次选择一个新的key来做讲解
count_netstat_wait_connections (TCP wait_connect数)
2.rate函数的使用
rate函数可以说是prometheus提供的最重要的函数之一。
rate()
rate()函数是专门搭配counter类型数据使用的函数
它的功能是按照设置一个时间段,取counter在这个时间段中的平均每秒的增量
这么说可能还有点抽象,举例说下
1
2
node_network_receive_bytes node_network_receive_bytes_total
这个例子使用的是node_exporter key node_network_receive_bytes_total
rate(node_network_receive_bytes_total[1m])
node_network_raceive_bytes_total本身是一个counter类型,字面意思也很好理解,网络接收字节总数
之前学过对于这种持续增长的counter数据,直接输入key是没有任何意义的
我们必须要以获取单位时间内增量的方式来进行加工才能有意义。
那么,对于counter数据,进行第一步初始化的增量获取加工,通常的使用方法就是直接用reate()包上,(increase(),也是可以的,后面会说到)
node_network_receive_bytes_total被rate(.[1m])包上以后,就可以获取到在1分钟时间内,平均每秒钟的增量。
这样一来,数据就变得有意义了。
所以说,以后在使用任何counter数据类型的时候,永远记得,别的先不做,先给它加上一个rate()或者increase()
接下来我们把rate()做的事情,更加细化的来解释下。
比如上面的这个图,网络接收字节数一直不停的累加。
从09:40开始到09:41,比如累积量从746250282到了746251282
一分钟内,增加了1000bytes(假设)
从09:41开始到09:46
比如累积量从746251282到了746256282(假设)
加入rate(.[1m])之后
会把1000bytes除以1m*60秒。=~16bytes
就是这样计算出在1分钟内,平均每秒增加16bytes。
接下来把1m修改为5m
1 rate(node_network_receive_bytes_total[5m])
这样就变成把5分钟内的增量除以5m*60
5分钟内的增量假如是5000,那么除以300以后,也还是约等于16bytes.
感觉好像是一模一样的
那么我们看下输出rate[5]
会发现 图形和上面的1分钟发生了一定的变化。
事实是这样的,
如果我们按照rate(1m)这样来取,那么取1分钟内的增量除以秒数
如果我们按照rate(5m)这样来取,那么是取5分钟内的增量除以秒数
而这种取法,是一种平均的取法,而且是假设的
刚才我们说counter在一分钟 5分钟之内的增量1000和5000其实是一种假设的理想状态,
事实上,在生产环境,网络数据接收量可不是这么平均的。
有可能在第一分钟内增加了1000,到第二分钟就变成增加了2500…
所以 ,rate(1m)这样的取值方法比起rate(5m),因为它取的时间段短,所以,在任何某一瞬间的凸起或者降低在成图的时候,会体现的更细致,更敏感。而 rate(5m)把整个5分钟内的都一起 平均了,那么当发生瞬时凸起的时候,会显得图平缓了一些,
那么放大到rate(20m)会怎么样,结果是会更加平缓 。
平时工作中取1m还是5m,这个取决于我们对于监控数据的敏感程度来挑选。
3.increase函数使用
increase函数其实和raate()的概念及使用方法 非常相似
rate()是取一段时间增量的平均每秒数量
increase()则是取一段时间增量的总量
比如
1
2
3
4
5
increase(node_network_receive_bytes_total[1m]) 取的是1分钟内的增量总量 和 rate(node_network_receive_bytes_total[1m]) 取的是1分钟内增量除以60秒每秒数量
这两个函数查询数据的曲线走势基本是一样的,但是显示的数量bytes不一样,正好是60倍。
4.sum()函数学习
sum()函数的使用,就是取合,
sum会把结果集的输出进行总加合。
比如
1 rate(node_network_receive_bytes_total[1m])显示的结果集会包含如下内容。
从标签上可以看出,有很多台服务器都返回了这个监控数据
当我们使用sum()包起来后,
1
2
sum(rate(node_network_receive_bytes_total[1m])) 就变成现在的 一条线了
等于是给出了所有机器的每秒请求量,
如果要进行下一层的拆分,需要在sum()的后面加上by(instance)才可以按照机器名拆分出一层来
sum()加合其实还有更多巧妙使用。
sum() by(cluster_name)
如果是by instance那么其实跟不加sum()的输出结果是一样的。
本来rate(node_network_receive_bytes_total[1m])就已经是按照每台机器返回了,
但是如果我们希望按集群总量输出呢,比如 ,我们返回了20台机器的数据,
其中有6台属于web server,10台属于DB server,其他的属于一般server
那么我们这时候sum() by(cluster_name)就可以帮我们实现集群加合并分成三条曲线输出了,顺带一提的是(cluster_name)这个标签,默认node_exporter是没有办法提供的,node_exporter只能按照不同的机器名去划分,如果希望支持cluster_name,我们需要自行定义标签。
目前我们学了rete() increase() sum() by()函数。
其实prometheus还提供了更多的函数让我们调用,只不过更加专业化了,
5.topk()函数的学习
定义:取前几位的最高值
1 topk(3,count_netstat_wait_connections)
Gauge类型的使用
1 topk(3,count_netstat_wait_connections)
Counter类型的使用
1 topk(3,rate(node_network_receive_bytes_total[20m]))
这个函数还是比较容易理解的,根据给定的数字,取数值最高>=x的数值,
需要注意的是这个函数一般在使用的时候,只适合在console查看,graph的意义不大,
topk因为对于每个时间点都只取前三高的数值,那么必然会造成单个机器的采集数据不连贯,
比如:server01在这一分钟的wait_connection数量排在所在机器的前三,到了下一分钟,可能就垫底了,自然曲线就会中断,
实际使用的时候一般用topk()函数进行瞬时报警,而不是为了观察曲线。
6.count()函数的学习
定义:把数值符合条件的输出数目进行加合,
比如,找出当前(或者历史的)当TCP等待数大于200的机器数量
1 count(count_netstat_wait_connections>200)
这个函数在实际工作中还是很有用的,一般用它进行一些模糊的监控判断。
比如说 企业中有100台服务器,那么当只有10台服务器CPU高于80%的时候,这个时候不需要报警,但是当符合80%CPU的服务器数量超过30台的时候那么就会触发报警。
其他更多的函数可以在prometheus官方网站继续学习
1 https://prometheus.io/docs/prometheus/latest/querying/functions/
pushgateway的使用 pushgateway是另一种采用被动推送的方式(而不是exporter主动获取)获取监控数据的prometheus插件,
它是可以单独运行在任何节点上的插件(并不一定要在被监控客户端)
然后通过用户自定义开发脚本 把需要监控的数据,发送给pushgateway,然后pushgateway再把数据推送给prometheus server
pushgatway的安装运行和配置。
pushgateway和prometheus和exporter一样
1
2
3
4
5
6
7
8
9
10
11
12
13
14
15
16
https://prometheus.io/download/ wget https://github.com/prometheus/pushgateway/releases/download/v1.5.1/pushgateway-1.5.1.linux-amd64.tar.gz 上面的报错,可以加参数--no-check-certificate wget https://github.com/prometheus/pushgateway/releases/download/v1.5.1/pushgateway-1.5.1.linux-amd64.tar.gz --no-check-certificate 解压 tar xzf pushgateway-1.5.1.linux-amd64.tar.gz mv pushgateway-1.5.1.linux-amd64 /usr/local/pushgateway 通过后台tmux方式运行。 cd /usr/local/pushgateway ./pushgateway netstat -putnal |grep pushgateway 默认端口9091
关于pushgateway的配置,主要指的是在prometheus server端的配置
1
2
3
- job_name: "pushgateway" static_configs: - targets: ['localhost:9091']
在prometheus.yml配置文件中,单独定义一个job,然后target指向到pushgateway运行所在的机器名和端口,
自定义编写脚本的方法,发送pushgateway采集
pushgateway本身是没有任何抓取监控数据的功能的,它只是被动的等待推送过来,所以需要学习pushgateway编程脚本的写法。
如下是一段生产环境中使用shell编写的pushgateway脚本
用于抓取TCP waiting_connection 瞬时数量
1
2
3
4
5
6
7
8
9
10
11
12
13
14
15
cat /usr/local/node_exporter/node_exporter_shell.sh # !/bin/bash instance_name=$(hostname -f | cut -d'.' -f1) #本机机器名,变量用于之后的标签。 if [ $instance_name == "localhost" ];then #要求机器名不能是localhost,要不然标签就没法区分了。 echo "Must FQDN hostname" exit 1 fi # For waitting connections label="count_netstat_wait_connections" #定一个新的key count_netstat_wait_connections=$(netstat -an | grep -i wait | wc -l) #定义一个新的值netstat中wait的数量 echo "$label:$count_netstat_wait_connections" echo "$label $count_netstat_wait_connections" | curl --data-binary @- http://localhost:9091/metrics/job/pushgateway/instance/$instance_name
#最后把key & value 推送给pushgateway
curl –data-binary
将HTTP POST请求中的数据发送给HTTP服务器(pushgateway),与用户提交html表单时浏览器的行为完全一样。
HTTP POST请求中的数据为纯二进制数据。
脚本最重要的两行
1
2
3
4
5
6
7
8
9
10
11
12
13
count_netstat_wait_connections=$(netstat -an | grep -i wait | wc -l) 后面的linux命令行就简单的获取到了我们需要监控的数据TCP_WAIT数 http://prometheus.server.com:9091/metrics/job/pushgateway1/instance/$instance_name 最后这里用post方式把key & value推送给pushgateway的url地址。 这个URL地址中,分成如下三个部分 http://prometheus.server.com:9091/metrics/job/pushgateway1/ 这里是URL的主location job/pushgateway1 这里是第二部分,第一个标签:推送到哪一个prometheus定义的job里, instance/$instance_name 这里是第二个标签,推送后显示的机器名是什么
通过这样的脚本编程方式。我们可以很快速的自定义我们需要的任何监控数据
这个我们编写的监控bash脚本是一次性执行的 ,需要按照时间段反复执行,需要结合contab了。
这里说一下,
crontab默认只能最短一分钟的间隔,如果希望小于一分钟的间隔,
我们使用如下的方法
sleep 10
sleep 20
1
2
* * * * * /usr/local/node_exporter/node_exporter_shell.sh * * * * * sleep 20; /usr/local/node_exporter/node_exporter_shell.sh
之后回到prometheus主界面,尝试输入我们自己定义的new_key 看看结果,
key的名字就是这个label=”count_netstat_wait_connections”
其他种类的监控数据都可以使用类似的形式直接写脚本发送,使用python也是很好的方式,
使用pushgateway的优缺点
pushgateway这种自定义的采集方式非常的快速,而且极其灵活,几乎不受到任何约束,
一般情况下,只安装node_exporter和DB_exporter两个,其他种类的监控数据可以使用pushgateway的方法采集。
prometheus结合grafana 官方网站
1
2
3
4
5
6
7
8
9
10
11
12
13
14
https://grafana.com/ https://grafana.com/grafana/download 下载: yum install -y https://dl.grafana.com/enterprise/release/grafana-enterprise-9.4.7-1.x86_64.rpm 或者 wget https://dl.grafana.com/enterprise/release/grafana-enterprise-9.4.7-1.x86_64.rpm yum install -y grafana-enterprise-9.4.7-1.x86_64.rpm 启动 systemctl start grafana-server 检查grafana是否启动成功,grafana启动时会占用3000端口 lsof -i:3000
grafana部署成功时,可以http访问,ip就是grafana服务的服务器host
1
2
3
登录地址:http://192.168.224.11:3000/ 账号:admin/admin 登陆成功后修改新密码。
grafana 安装成功后,会在/etc/grafana目录生成配置文件grafana.ini
1.如果需要开启匿名访问,需要修改如下参数
1
2
3
4
5
6
7
vim /etc/grafana/grafana.ini # 开启匿名访问 enabled = true # 给匿名访问者一个组织 org_name = Main Org. #给匿名访问者一个访问权限,Viewer表示浏览权限,Editor编辑权限,Admin管理员权限 org_role = Viewer
2.如果需要开放浏览器iframe嵌套grafana页面设置,需修改如下参数
1
2
3
vim /etc/grafana/grafana.ini # 允许浏览器渲染grafana到iframe allow_embedding = true
修改了配置之后需要重启grafana
1 systemctl restart grafana-server
3.隐藏grafana左侧菜单和顶部面包屑
只要在url后面追加 &kiosk 参数
1 示例:http://192.168.224.11:3000/?orgId=1&kiosk
添加数据源
主题设置
部署成功后默认只有dark和light两种主题,light白色主题比较刺眼,dark主题看久了有视觉疲劳,grafana可以支持自定义主题设置
1
2
3
4
安装插件 grafana-cli plugins install yesoreyeram-boomtheme-panel systemctl restart grafana-server
2.检查插件是否安装成功
下载主题样式css文件到grafana指定目录
1 推荐grafana主题样式gitub地址:https://github.com/gilbN/theme.park
1.创建存放css样式的目录
1
2
3
4
5
6
7
8
9
10
11
grafana部署成功后,会自动创建/usr/share/grafana目录,这些是存放静态资源的 cd /usr/share/grafana/public mkdir css cd css mkdir theme-options pwd /usr/share/grafana/public/css /usr/share/grafana/public/css目录作为存放基础css的目录 /usr/share/grafana/public/css/theme-options是存放主题样式的目录
2.在上述github上找到grafana-base.css 和transparent.css
说明:
grafana-base.css文件在css/base/grafana目录下
transparent.css文件在css/defaults目录下
3.将上述两个文件下载到/usr/share/grafana/public/css目录下
4.在grafana-base.css文件引入transparent.css文件
编辑grafana-base.css,在文件顶部添加@import url(“transparent.css”); ,以相对路径引入transparent.css
5.下载主题样式文件
将github上css/theme-options中所有css文件下载到/usr/share/grafana/public/css/theme-options目录
6.为样式css文件引入grafana-base.css
theme-options目录中所有的css文件头部添加@import url(“../grafana-base.css”); ,以相对路径引入grafana-base.css
1 @import url(“../grafana-base.css”);
然后重启grafana
启用主题
登录grafana > + > dashboard
创建panel
panel > visualization > boom panel > themes > Add New Theme
主题参数
1 2 http://192.168.224.11:3000/public/css/theme-options/aquamarine.css
设置默认主题
dashboard模板导入 对于常用的服务监控,例如主机节点监控,elasticsearch等等常见的服务,grafana官方有已经建好的dashboard面板模板,只要去grafana官网导入模板即可。
1 常用dashboard模板地址: https://grafana.com/grafana/dashboards/
例如:要为prometheus监控elasticsearch导入一个dashboard模板
1 2 模板搜索 datasource 选择prometheus
Copy模板id
注意:你要导入的dashboard模板要与自己安装的elasticsearch_exporter插件要匹配,不然数据可能不会展示
1 2 3 4 5 6 7 8 9 10 11 12 13 14 15 16 17 18 19 20 下载地址 wget https://github.com/prometheus-community/elasticsearch_exporter/releases/download/v1.5.0/elasticsearch_exporter-1.5.0.linux-amd64.tar.gz 加入后台启动, vim /etc/systemd/system/elasticsearch_exporter.service [Unit] Description=elasticsearch_exporter After=syslog.target network.target [Service] Type=simple RemainAfterExit=no WorkingDirectory=/usr/local/elasticsearch_exporter/ User=root Group=root ExecStart=/usr/local/elasticsearch_exporter/elasticsearch_exporter --es.all --es.indices --es.cluster_settings --es.node="daily_test" --es.indices_settings --es.shards --es.snapshots --es.timeout=5s --web.listen-address ":9114" --web.telemetry-path "/metrics" --es.ssl-skip-verify --es.clusterinfo.interval=5m --es.uri http://localhost:9200 Restart=always RestartSec=5 [Install] WantedBy=multi-user.target
粘贴模板id到load栏
同样可以添加其他node_exporter模板
1
2
3
ID是: 1860 nginx监控的模板ID 9614
pagerduty 注册新账号(免费试用14天)
1
2
3
4
https://signup.pagerduty.com/accounts/new 参考步骤,现在需要企业邮箱账号才可以注册 https://help.aliyun.com/document_detail/266641.html
创建New Service 之后把new service’s interation key 复制到grafana平台notification_channel 中,就完成了grafana+pagerduty的连接。
然后设置一下pagerduty给用户发送报警信息
回到Pagerduty的主页面,找到设置里的users选项卡。
然后点击个人信息,进行相关设置
之后就可以正式开始使用了,
在企业中使用的时候,把所有需要接收报警信息的员工手机号,邮箱地址同时都设置上,这样一来,每一次发送报警,所有被加入的员工就都会收到了。